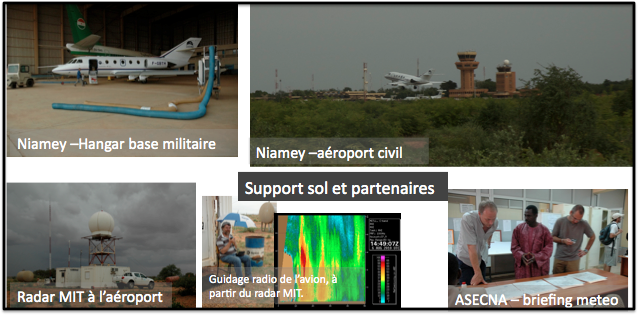
The first CNES funded ground validation campaign took place in Niamey in August 2010. The Falcone 20 aircraft made 11 successful flights in Sahelian Mesoscale Convective Systems (MCS) providing a good variety of case studies. On the ground the Xport Xband polarimetric radar provided information on the 3D structure inside the MCS and a classification of the hydrometeors type that can be compared to in situ measurements. The MIT C-band radar (stationed in Niamey since the AMMA campaign) was operated thanks to NASA/GPM support and played a key role in guiding the aircraft precisely inside the African MCS.
The objective of the campaign was to combine scales and methodologies to converge towards a parameterization of the ice size, mass and density law inside continental MCS :
-polarimetric radar based Particle Identification provides a climatology of particles classification as a function of season, lifecycle, type of the system
-On a limited number of systems, the airborne microphysics sensors provide a detailed in situ reference on the PSD. The in situ PSDs can be compared with the radar PID in the radar pixels located along the flight trajectory and gives a guideline to quantitative interpretation of radar PID elsewhere .
-A parametrization of the particle size and density can be set in the RTM used to build the retrieval database of BRAIN.
Niamey 2010 set up included :
-the instrumented Falcon 20 from SAFIRE, with onboard 2 hydrometeor imagers (2D-S and PIP, for particles in the range 10-1280 µm and100-6400 µm respectively) and the FSSP-100-ER probes, and the airborne 94 GHz RASTA radar.
-2 ground radars : the C-band MIT radar and the X-Port Xband polarimetric radar
-3 pairs of disdrometers le,t to us par the University of Castilla-La Mancha (UCLM)
-the raingage network from the AMMA-CATCH Niger ‘square degree of Niamey’.
MT Niamey 2010 aircraft radar microphysics campaign: set up sumary
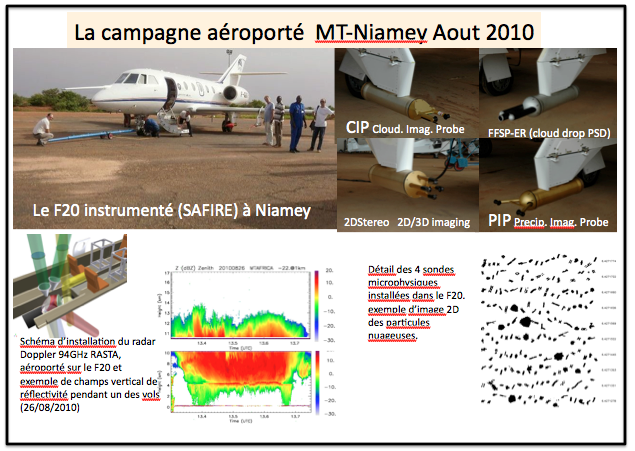
Details of the equipment of the Niamey 2010, airplane/radar campaign
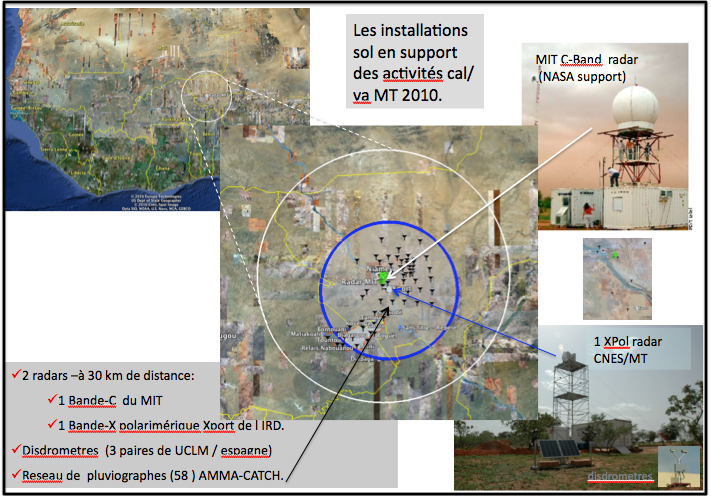
Summary of the ground based support during Niamey 2010, with the 2 weather radars, rain gages network and disdrometers.
More images from the Niamey campaign here.
Some results:
11 successfull flights were realized sampling a good variety of MCS at different stages of their life cycle:
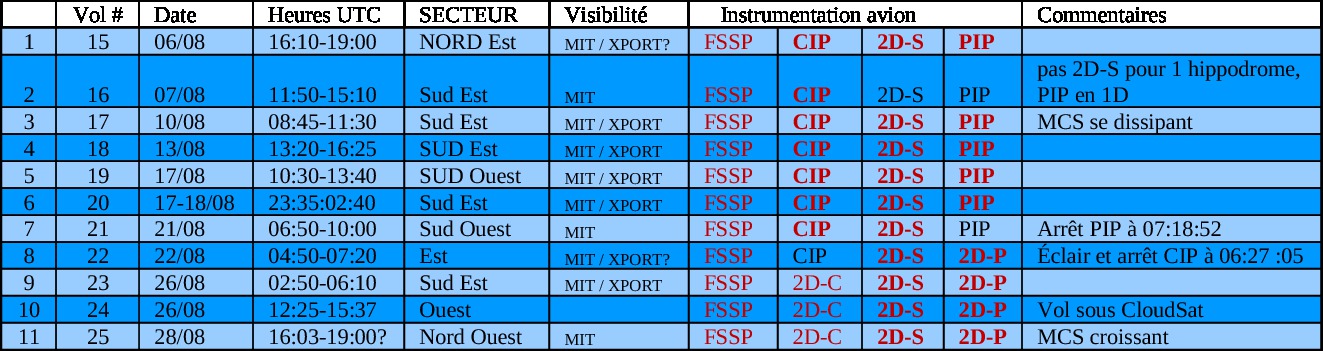
See also the MIT radar and Xport quicloooks on the flight dates here .
Airborne based analysis of particle size distribution and ice density:
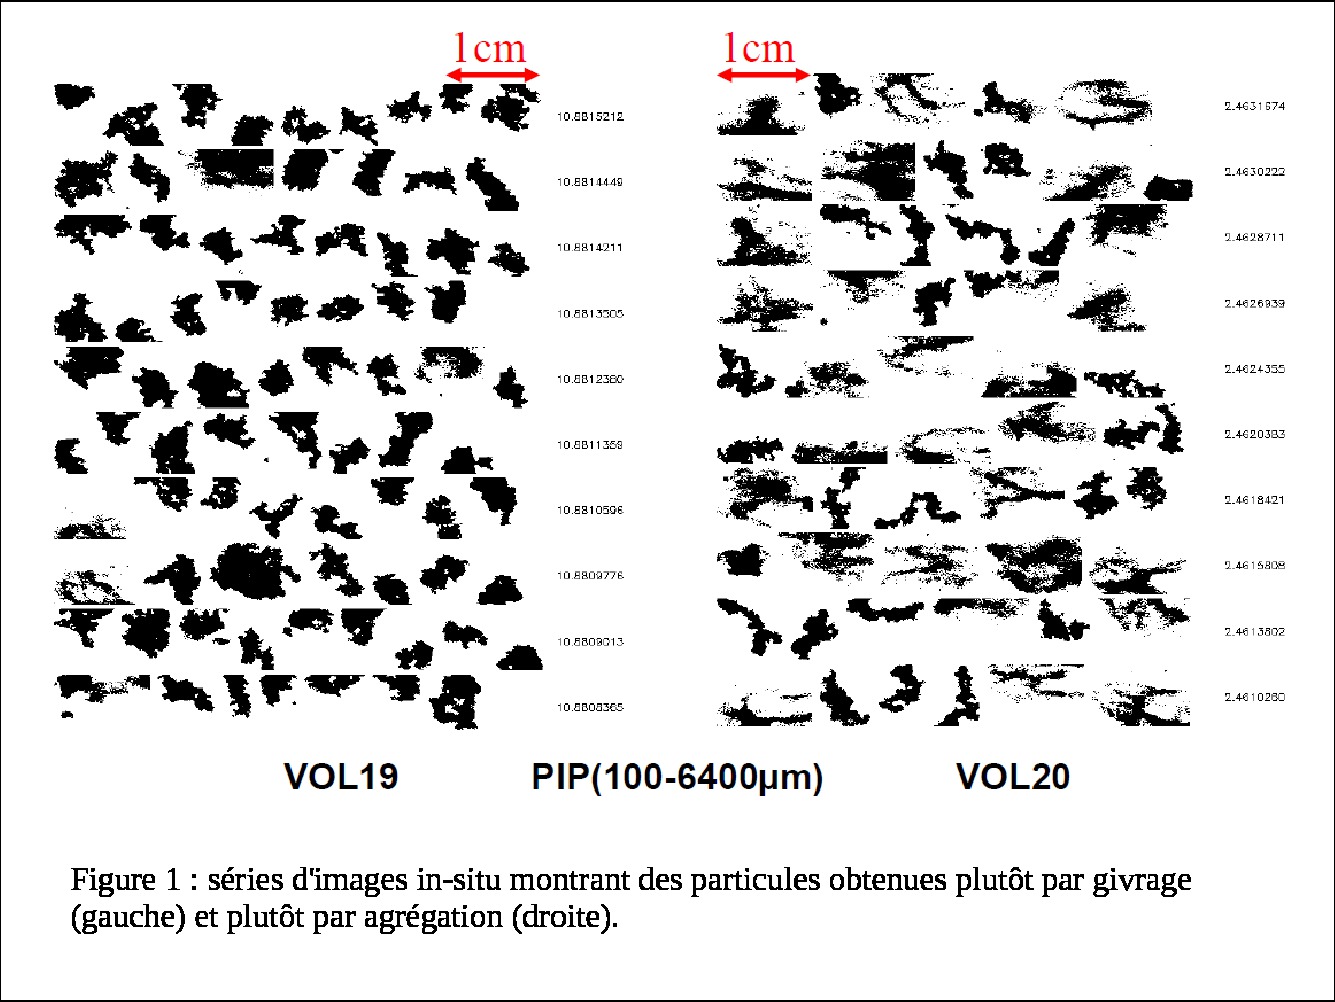
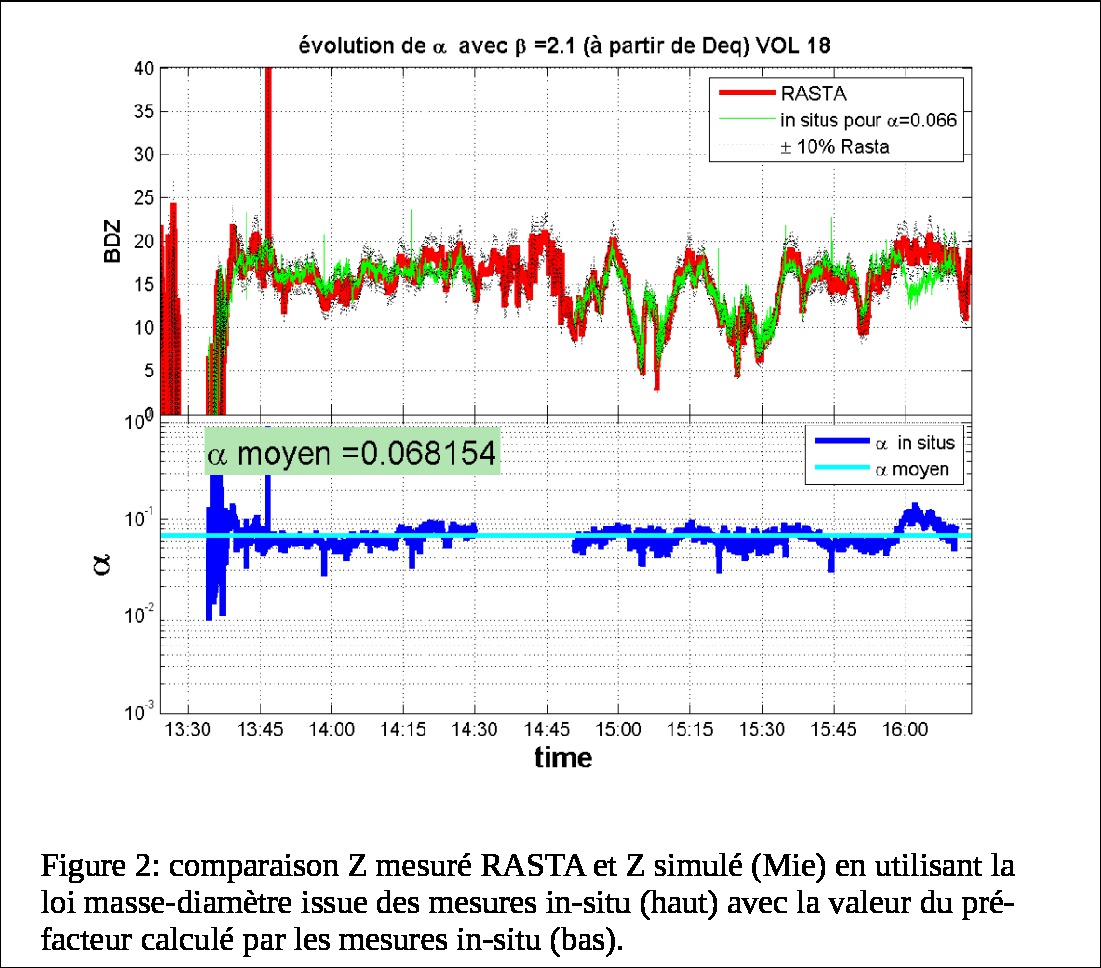
The top image illustrate the contrasted types of particles encountered in 2 different flights. Dense particles associated to a riming process (left) and lighter particles issued from aggregation process.Automatic classification and interpretation of the probe images is used to study the mass diameter relationship and its evolution inside the system. In the bottom figure the prefactor of the mass-diameter power law relationship is shown (blue line) as well as comparison of the PSD-Mie simulated (green) and RASTA radar observed (red) reflectivities along the flight, illustrating a good agreement for most of the flight.
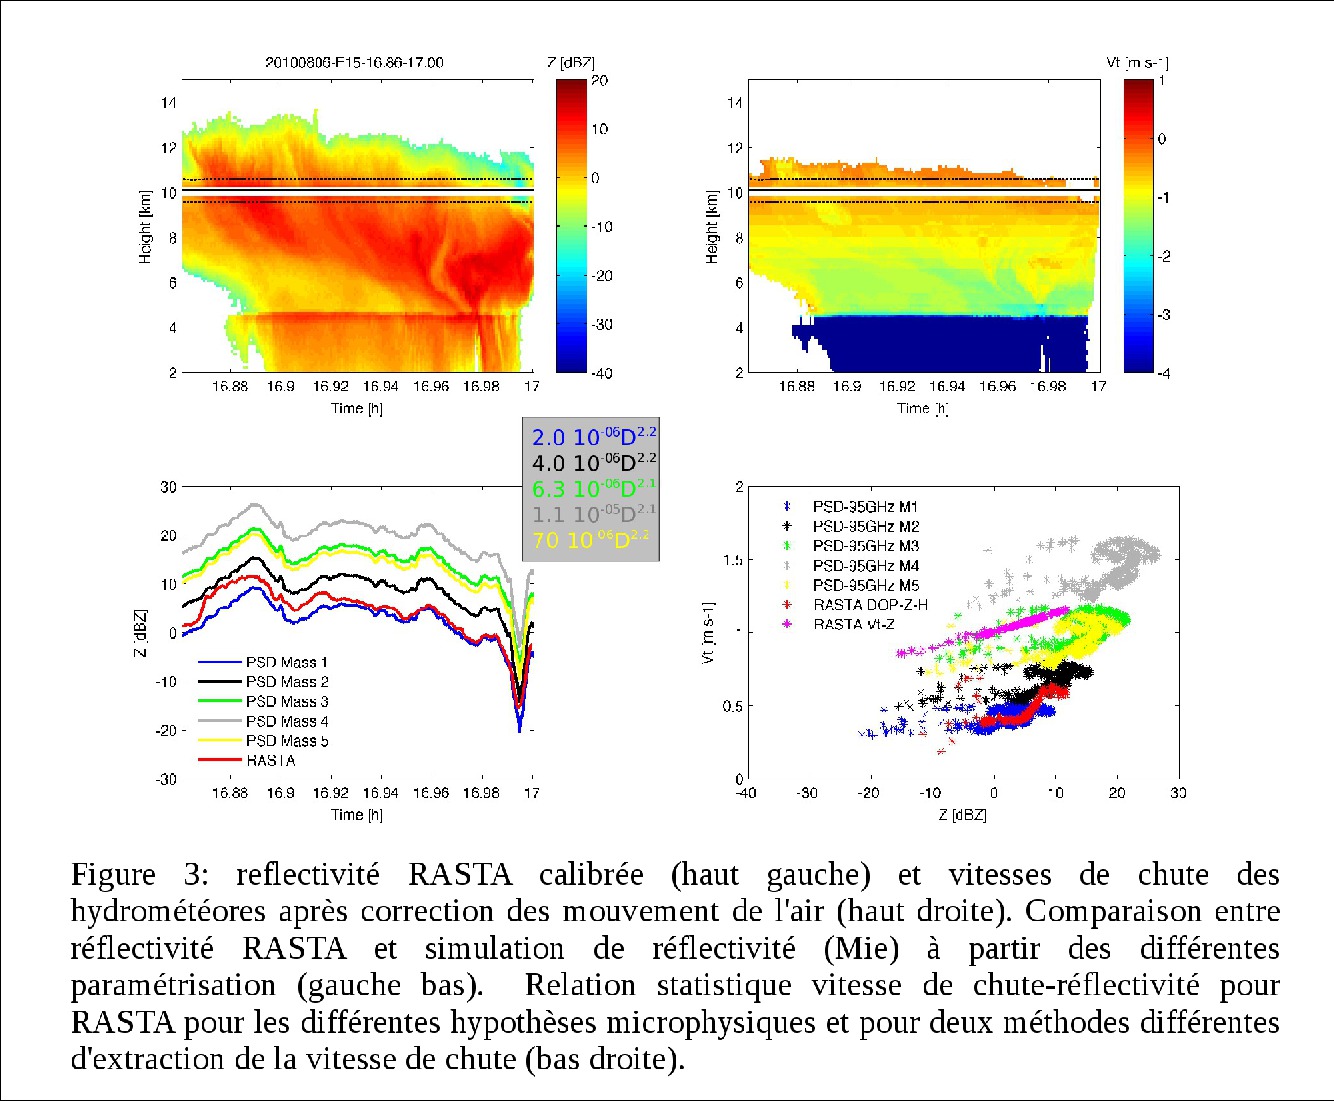
The picture above illustrates the use of the airborne RASTA radar to analyse the mass-diameter relationship through the reflectivity (Z) / fall speed relationship. The observed time evolution of the reflectivities (bottom-left) and of the speed-reflectivity pairs (bottom-right) are compared with those simulated with a scattering code and the in situ observed PSD for various ice density assumptions. The density law providing the best match between simulation and observations is chosen.
A variability in the ‘best’ law is observed within the MCS and from one MCS to another.
See also the quicloooks of the 94 Ghz radar and more results on the RASTA site: http://rali.projet.latmos.ipsl.fr/
Hydrometeors classifications and space-time variability from Xport:
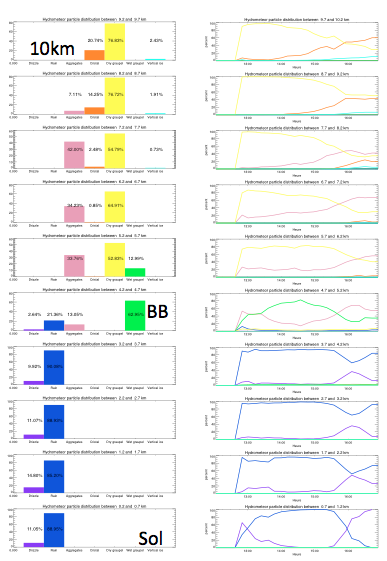
Xport based particles classification for the 13th of august case : the left pannnel shows the vertical evolution of the proportions of each of the 7 particle class, within the stratifom region, with a marked brigh band. The right panel shows the time evolution these proportions as the MCS is moving above the radar. Showing that the further from the convection the lighter the particles above the bright band (aggregates are becoming more frequent to the expenses of denser particles like dry graupels). This result needs to be generalized and quantified before integration is the BRAIN RTM PSD parametrization.