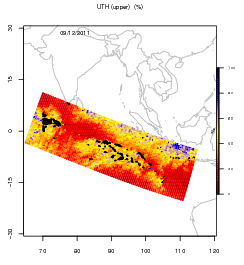
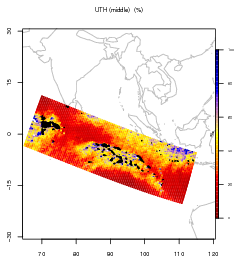
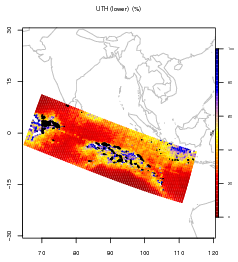
Level-2B products
The Level 2-UTH product has also been projected on a 1°x1° grid to create this L2-B product.
Documentation
Product Definition Document: Instantaneous Level 2 products, UTH derived from SAPHIR (L2 files format UPDATED November 2015)
Level 1 products definition (CNES documentation)
References
Brogniez, H., G. Clain, and R. Roca, 2015: Validation of upper-tropospheric humidity from SAPHIR onboard Megha-Tropiques using tropical soundings. J. Appl. Meteor. Climatol., 54, 896–908, doi:10.1175/JAMC-D-14-0096.1.
Buehler and John, 2005: A simple method to relatve microwave radiances to upper tropospheric humidity, J. Geophys. Res, 110, doi:10.1029/2004JD005111.
Schmetz and Turpeinen, 1988: Estimation of the Upper Tropospheric Relative Humidity field from METEOSAT water vapor image data, J. App. Meteor., 27, 889-899.
Soden and Bretherton, 1993: Upper Tropospheric Relative HUmidity from the GOES 6.7 microns channel: Method and climatology for July 1987, J. Geophys Res., 98, 16,669-16,688.
Spencer and Braswell, 1997: How dry is the tropical free troposphere ? Implications for a global warming theory. BAMS, 78, 1097-1106.
6-layer averaged relative humidity profiles are estimated from SAPHIR BTs. The retrieval is described in Sivira et al (2015). It is based on generalized additive model and provided the best estimate of the RH within 6 atmospheric layers, associated to the algorithmic confidence interval (1-sigma) (Brogniez et al., 2016). This retrieval scheme, named ARPIA (« Atmospheric Relative humidity profile Including the Analysis of confidence intervals), considered cloud-free and cloudy conditions, oceanic and continental scenes. The only limit is for icy layers on top of convective clouds and for precipitating conditions, which are withdrawn using the Hong et al (2005) threshold method adapted for SAPHIR channels.
Compared to the RH estimation scheme used in the previous version (v2 of the L2 products) (and described by Brogniez et al (2016)) which relied on Normal distributions, the current v3 (updated on march 2017) relies on a Beta distribution as its compact support and allowance for asymmetries about the mean are more favorable for describing the relative humidity. The estimation of parameters also provides a characterization of the retrieval uncertainty of RH for every observing pixel of SAPHIR.
The 6 layers for relative humidity are defined by their heights as follows:
L1 : 100 hPa – 200 hPa
L2 : 250 hPa – 350 hPa
L3 : 400 hPa – 600 hPa
L4 : 650 hPa – 700 hPa
L5 : 750 hPa – 800 hPa
L6 : 850 hPa – 950 hPa
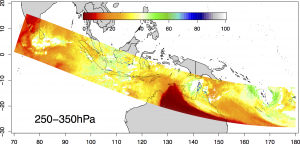
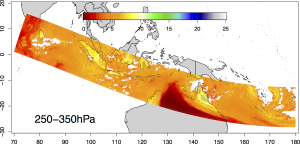
Figure 2: The Cyclone Pam (13 march 2015): the RH product for the layer 250-350 hPa (top) and the corresponding standard deviation (bottom)
Level-2B products
Documentation
Product Definition Document: Instantaneous Level 2 products, RH derived from SAPHIR (updated version 3 for the L2 RH product, march 2017 )
References
Sivira, R., H. Brogniez, C. Mallet, and Y. Oussar (2015), A layer-averaged relative humidity profi le retrieval for microwave observations: design and results for the Megha-Tropiques payload, Atmos. Meas. Tech, 8, 1055-1071